

Magazine
January 2024

PitNews
Your Trusted Source for Trading Intelligence: www.PitNews.com

Claire Kristensen
Wall Streets Puppet Masters:
Market Manipulation
Aiden Gray
The Hidden World of
Prop Firms: Fact or Fiction?


The Hidden World of Prop Firms:
Separating Fact From Fiction
by Aiden Gray: Page 39
Take a deep dive into the world of proprietary trading firms, dissecting the alluring yet
often misleading promises of financial freedom. It provides valuable insights and warnings,
guiding traders through the complex landscape of prop firms to distinguish between
genuine prospects and deceptive traps.

The Puppet Masters of Wall Street:
Unmasking the Art of Market Manipulation
by Claire Kristensen Page 14
Unveil the complex world of market manipulation, how large players like hedge funds and
banks can influence the market, often to the detriment of retail traders, specifically
breaking down the "pump 'n dump" strategy, offering insights into the mechanics, to equip
traders with the knowledge to identify and navigate these deceptive market maneuvers.

The Trend is Your Friend
Until it Bends or Ends
by Lan Turner: Page 5
The article introduces trend following as a disciplined and simple trading strategy, focusing
on its rule-based approach. It is positioned as a reliable alternative to the high-stress and
often unsuccessful attempts at predicting market reversals.

Big Macs & Beyond:
Exploring the Impact on Stocks, Futures and Bonds
by Dr. Scott Brown Page 24
Explores the Big Mac Index, a unique economic indicator that uses the price of McDonald's
Big Macs globally to understand purchasing power parity and inflation trends. It explains
how this seemingly simple measure provides insights into currency value discrepancies and
broader economic principles affecting stock and futures markets.

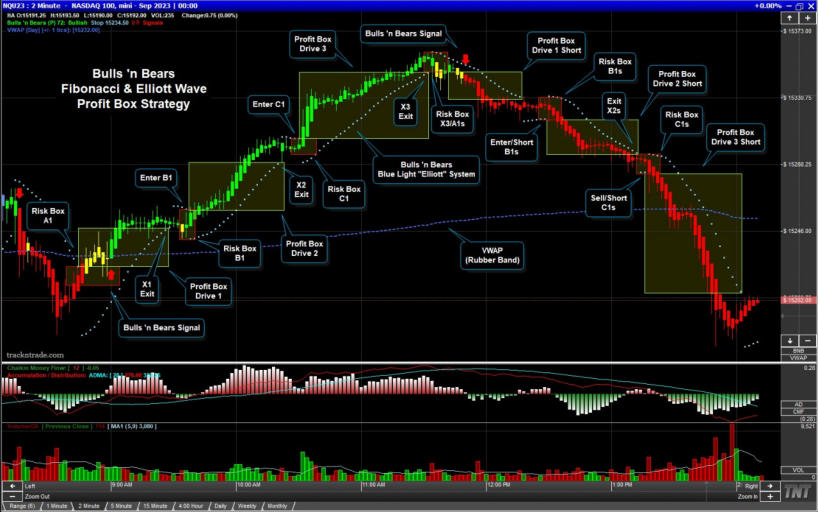
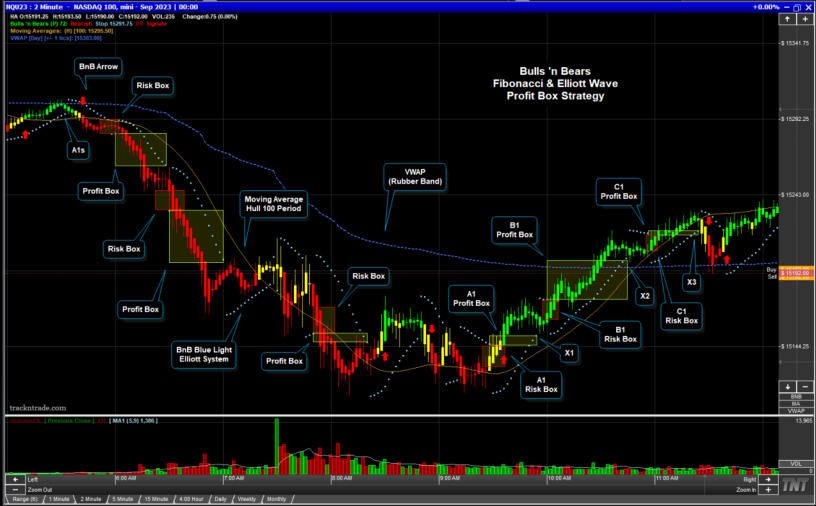
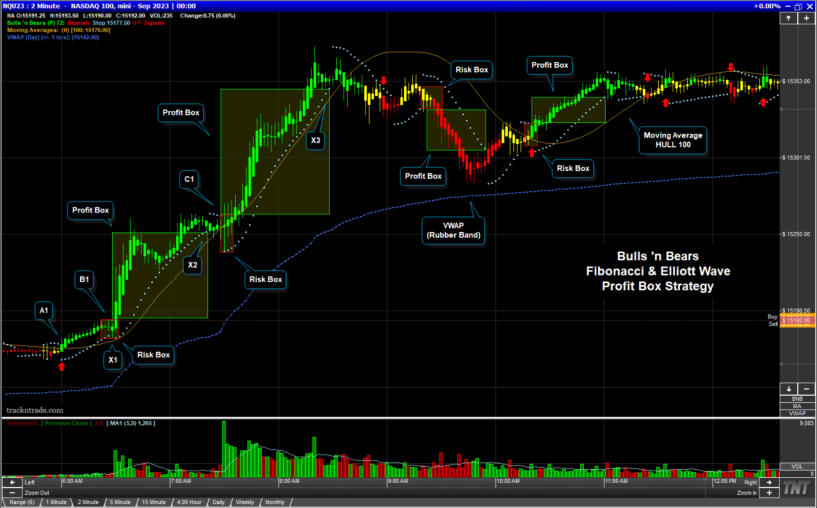
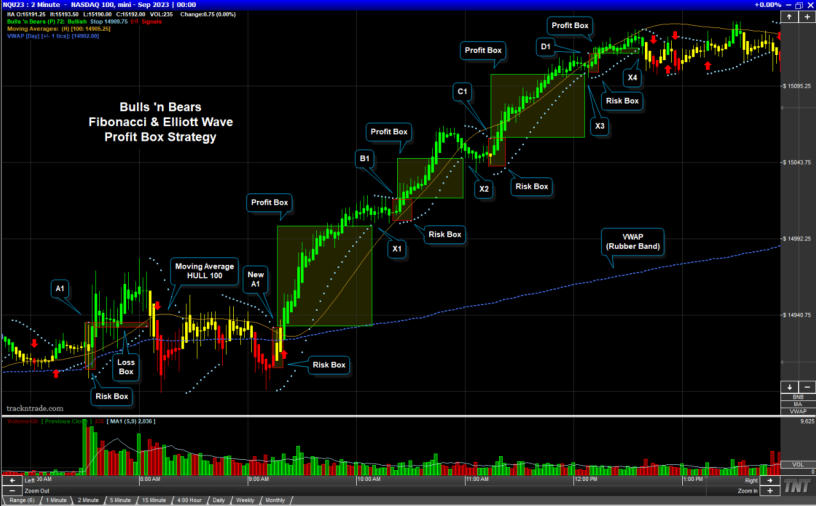
Navigating the Profit Box:
The Art and Strategy of Scalp ‘n Trail
by Lan Turner Page 29
Navigating the 'Profit Box,' a metaphorical zone bounded by the entry and exit points in
trading, highlighting the challenges and strategies for maximizing gains within this space. It
discusses the limitations of relying solely on lagging indicators and emphasizes the need for
a nuanced approach to effectively manage the narrow window of opportunity.

Table of Contents:
Your Guide to Mastering the Markets


Disclaimer: There is a chance of loss when trading Stocks, Futures and Options.
See full risk disclosure online at: PitNews.com/risk.htm Copyright © PitNews Press, Inc.

Dear Valued Subscribers,
As we turn the page to a new year, I want to extend a heartfelt thank you for your
continued support of PitNews Magazine. Your engagement and enthusiasm are what
drive us to deliver insightful and practical content each month. As we step into January,
a time of fresh beginnings and renewed aspirations, we wish you prosperity, success, and,
most importantly, good health in the year ahead.
This month's issue is particularly special, as it encapsulates a diverse range of topics that
are not only informative but also thought-provoking. Here's a glimpse of what you'll
find inside:
1.
"The Trend is your friend until it bends or ends," by Lan Turner: An enlightening
exploration of trend following and its critical role in successful trading strategies.
2.
"The Puppet Masters of Wall Street: Unmasking the Art of Market Manipulation,"
by Claire Kristensen: A revealing look into the tactics of market manipulation,
providing crucial knowledge for navigating these deceptive strategies.
3.
"Big Macs & Beyond: Exploring the Impact on Stocks, Futures, and Bonds," by Dr.
Scott Brown: Dr. Brown's expert analysis of how the Big Mac Index reflects broader
economic principles and their influence on financial markets.
4.
"Navigating the Profit Box: The Art and Strategy of Scalp 'n Trail," by Lan Turner,
where we dive into the 'Profit Box' concept, offering strategies for optimizing profit
potential in trading.
5.
"The Hidden World of Prop Firms: Separating Fact from Fiction," by Aiden Gray:
Aiden guides us through the complexities of proprietary trading firms, helping to
distinguish between genuine opportunities and potential scams.
Each article has been crafted with the aim of enriching your understanding and
enhancing your trading strategies. As we continue to navigate the ever-evolving world
of finance, our commitment to bringing you the most relevant and insightful content
remains unwavering.
Thank you once again for being a part of our PitNews family. Here's to a prosperous
and insightful 2024!
Warm regards,
Lan Turner, Editor-in-Chief
PitNews Magazine
Editor's Notes: January
Page: 3


In the heart of the city, where the tall towers gleam,
Lies the bustling world of the trading stream.
Where numbers dance, and fortunes rise,
Under the watchful gaze of winter skies.
In this realm of dreams, where traders tread,
New Year's resolutions are silently said.
"Buy low, sell high," the age-old creed,
In the New Year's promise, we find our lead.
Gideon P. Thornfield, a trader of note,
With a lucky tie and a well-tailored coat,
Stood at the stroke of midnight, his eyes alight,
Ready for a year of markets, bold and bright.
"Let's toast," he said, "to the trades we'll make,
To the risks we'll dare and the chances we'll take.
To the bulls that charge with unstoppable force,
And to the bears, of course, who plot their course.
May our portfolios grow, our spirits never tire,
As we chase the dreams that our hearts desire.
May the market's waves, both fierce and fair,
Bring us fortune, in the bull's lair.
So here's to the New Year, fresh and new,
Full of opportunities, for me and you.
In the dance of digits, let's find our stride,
In this grand adventure, let's enjoy the ride.
With a clink of glasses and a hopeful cheer,
They welcomed the start of the trading year.
For in this world, where fortunes are spun,
A new year of trading has just begun.
A Trader's New Year's Tale
by Gideon P. Thornfield
Disclaimer: There is a chance of loss when trading Stocks, Futures and Options.
See full risk disclosure online at: PitNews.com/risk.htm Copyright © PitNews Press, Inc.
by Lan Turner
The Perils of Chasing Perfection in Trading
Last summer, while visiting the sunny beaches of
California, I recall watching surfers take on the
powerful waves. As I dug my toes into the warm
sand, I was particularly drawn to one surfer who sat
on his board, waiting. He seemed to be waiting with
a great sense of anticipation for the perfect wave,
letting each smaller wave pass him by. At that
moment, I noticed a remarkable similarity to my
initial days in the financial markets.
Back when I first dug my toes into the world of
trading, I was that surfer. I spent hours, days, even
weeks trying to predict that one perfect trend—that
exact point where the market would reverse. It was
an elusive goal, much like catching the perfect wave.
My focus was so narrow, so fixated on this single
move, that I often missed out on the more consistent
and less risky opportunities that were right there in
front of me. These were the steady, more forgiving
waves that could have made for a smoother, though
perhaps less exciting, ride; the ones that were more
consistent and forgiving.
The Trend is Your Friend:
Until it Bends or Ends


Page: 5
Disclaimer: There is a chance of loss when trading Stocks, Futures and Options.
See full risk disclosure online at: PitNews.com/risk.htm Copyright © PitNews Press, Inc.
I learned the hard way that in trading, as in surfing,
it's not always about the glory of riding the biggest
wave. Sometimes, it's about recognizing and
embracing the smaller, more manageable ones that
can still take you a long way. These less dramatic
opportunities, which I initially overlooked in my
pursuit of a grand reversal, were the ones that
steadily built my confidence and skill as a trader.
This realization came to me over time, as I watched
the ocean and its surfers with a newfound
understanding. I began to see the financial markets
through the lens of the ocean—unpredictable,
powerful, but also full of opportunities, big and
small. It was a lesson in humility and patience, one
that taught me to broaden my view and appreciate
the consistent rhythms of the market, much like the
steady flow of the ocean waves.
In the world of trading, the debate between trend
following and trend reversal strategies is a
longstanding one. New traders, lured by the allure of
'big wins,' often gravitate towards predicting trend
reversals. The idea of entering at the lowest point
and exiting at the peak is enticing, but it's fraught
with challenges and risks. In contrast, trend following
- the practice of identifying and riding a trend -
offers a more pragmatic approach, especially for
those just starting out. This article explores why "the
trend is your friend" isn't just a catchy phrase, but a
fundamental trading principle that can guide new
traders towards more sustainable success.
The Fallacy of Trend Reversal Trading
The allure of trend reversal trading lies in its
perceived potential for massive gains. New traders
often envision themselves as the few who can
accurately predict the top or bottom of a market,
buying low and selling high with precision. This
aspiration, however, overlooks the inherent
complexity and unpredictability of financial markets.
Trend reversals are rare and difficult to forecast
because they are influenced by a myriad of factors,
including economic indicators, market sentiment,
and global events, many of which are unpredictable
or even unknown to the average trader. Moreover,
the market's momentum tends to persist. A trend in
motion is more likely to continue than to reverse
abruptly. By aiming for trend reversals, traders often
find themselves fighting against the market's natural
flow, a strategy that not only requires great skill and
experience but also exposes them to higher risks and
potential losses.
Predicting Market Reversals
I recall a period early in my trading career when I
was fixated on predicting market reversals. In one
instance, I was confident that a certain stock, which
had been on a steady decline, was due for a
rebound. I invested a significant portion of my
portfolio, expecting a quick turnaround. Instead, the
stock continued to plummet. This experience taught
me a valuable lesson about the risks of reversal
trading. It's not just about the potential financial loss;
it's the psychological impact of repeatedly being on
the wrong side of the market movement. The
frustration and self-doubt that comes after are often
far more damaging than the monetary loss.
This experience, which I might add, unfortunately,
has happened to me way more than I’d like to
admit. It highlights the inherent risks and emotional
toll of trying to capture trend reversals, a lesson that
has now steered me towards the more reliable and
less stressful strategy of trend following.
Trend Following: The Power of a Rule-Based
Approach
Trend following is a strategy grounded in discipline
and simplicity, which revolves around three rules:

Page: 6
Disclaimer: There is a chance of loss when trading Stocks, Futures and Options.
See full risk disclosure online at: PitNews.com/risk.htm Copyright © PitNews Press, Inc.
1.
Wait for a Trend to Begin: The first step is the
most crucial - identifying when a trend has
started. This involves monitoring market
movements and indicators to detect a consistent
upward or downward trajectory. It's about
patience and resisting the urge to jump in
prematurely.
2.
Jump on the Trend: Once a trend is established,
the next rule is to make your move. This doesn't
mean entering at any point; it involves waiting
for a strategic entry moment that aligns with
the trend's direction. It's about timing, not just
action.
3.
Take Profits as Markets Rally: Knowing when to
exit is as important as knowing when to enter.
Setting profit targets or using trailing stops
ensures that gains are realized before the trend
potentially reverses or loses momentum. It's
about safeguarding gains, not just accumulating
them.
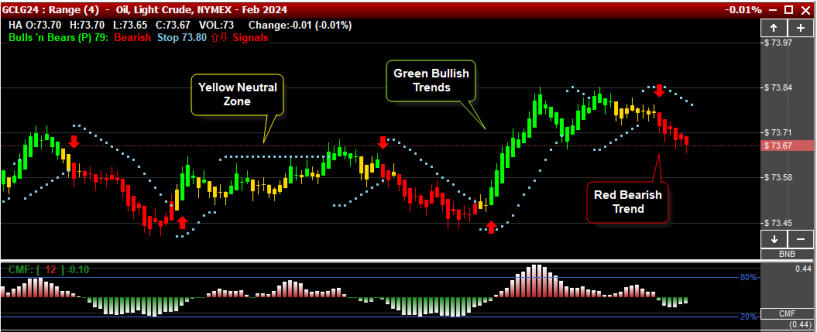
Bulls 'n Bears Indicator
A crucial tool in the arsenal of a trend follower is the
Bulls 'n Bears indicator. This color-coded system
simplifies market analysis:
•
Green Price Bars: Indicate a bullish market.
When the bars turn green, it signals an upward
trend, suggesting a buying opportunity.
•
Yellow Price Bars: Represent a neutral market.
Yellow bars indicate a period of consolidation or
indecision, suggesting caution.
o
The yellow bars represent the Fibonacci
neutral zone between 38.2 and 61.8.
•
Red Price Bars: Signify a bearish market. Red
bars indicate a downward trend, pointing
towards a selling opportunity or avoidance of
long positions.
Page: 7
ABCD Patterns
A buy/sell signal entry strategy after a two/three bar pull back. (Flagging)


Pattern, Setup & Trigger Recognition
Bullish
Bearish


Buy


Add


Sell


Add


Pennant/Flag

Pennant/Flag
A
B
C
D


D
A
B
C


Disclaimer: There is a chance of loss when trading Stocks, Futures and Options.
See full risk disclosure online at: PitNews.com/risk.htm Copyright © PitNews Press, Inc.
By utilizing the Bulls 'n Bears indicator, traders can
visually assess market conditions, helping them to
identify trends early and make informed decisions on
entries and exits. This tool simplifies the process,
making trend following more accessible, especially
for new traders.
Risks of Misguided Strategies: Statistics/Data
While comprehensive data on individual trading
outcomes is scarce due to the private nature of
trading accounts, various studies and broker reports
have suggested that a high percentage of new
traders incur losses; it’s said to be as high as 80%.
For instance, a report by a major brokerage firm
revealed that over 70% of new traders who focused
on reversal strategies ended up losing more than half
of their capital within the first year.
These statistics highlight the high-risk nature of
trying to predict market turns, especially for those
lacking in-depth experience and a robust risk
management framework.
Balanced View
It's essential to recognize that all trading strategies,
including trend following, come with inherent risks.
No strategy is foolproof. However, the key difference
lies in the approach and execution. Trend reversal
trading, while potentially lucrative, often requires a
deep understanding of market dynamics, the ability
to interpret complex signals, and, importantly, the
capacity to absorb significant losses.
On the other hand, trend following, with its rules-
based approach, provides a more structured and less
Page: 8
Accumulation & Distribution
The market “Chops” lower then breaks up.


Trend


Add


Accumulation
Stage (Choppy)

Distribution
Stage (Smooth)

CMF
Indicator

Accumulation
Stage (Choppy)
Disclaimer: There is a chance of loss when trading Stocks, Futures and Options.
See full risk disclosure online at: PitNews.com/risk.htm Copyright © PitNews Press, Inc.
emotionally taxing path, especially for new traders.
It's about riding the momentum, not predicting the
market's next move. This strategy does not eliminate
risks but rather manages them more effectively
through clear entry and exit rules, and the use of
tools like the Bulls 'n Bears indicator.
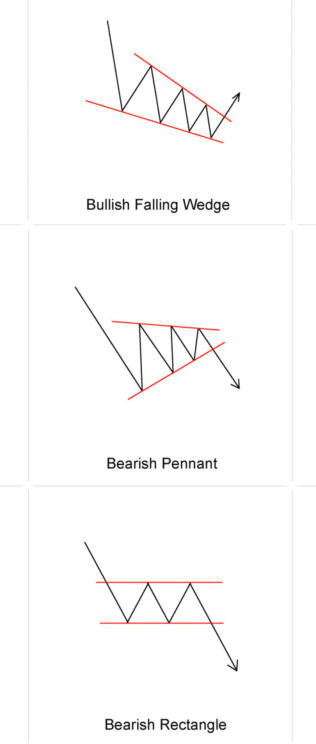
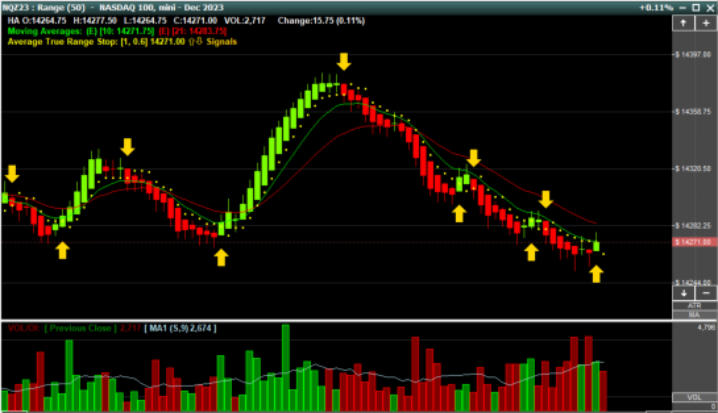
Technical Analysis: Identifying Entry Points
Classic chart formations like wedges, triangles, flags,
and pennants. These formations are pivotal in
technical analysis, serving as visual cues for
identifying potential entry points in a trending
market.
•
Wedge Formations: These appear as narrowing
price ranges, signaling a potential breakout. A
rising wedge in a downtrend or a falling wedge
in an uptrend often precedes a continuation of
the trend.
•
Triangle Patterns: These are seen as converging
trend lines and can be symmetrical, ascending, or
descending. They indicate a consolidation phase,
with a breakout typically signaling trend
continuation.
•
Flags and Pennants: Short, sharp price
movements followed by a slight, rectangular
(flag) or triangular (pennant) consolidation. A
breakout from these patterns usually suggests a
strong move in the direction of the prevailing
trend.
Technical Explanation
These chart formations are key in identifying
opportune moments to enter a trend. Here's how
they signal entry points:
•
Breakout Confirmation: In each of these
patterns, traders look for a breakout - a decisive
move out of the pattern, confirming trend
continuation. For instance, a breakout above a
triangle's upper trendline in an uptrend suggests
a strong entry point for a long position.
Page: 9
Disclaimer: There is a chance of loss when trading Stocks, Futures and Options.
See full risk disclosure online at: PitNews.com/risk.htm Copyright © PitNews Press, Inc.
Page: 10
•
Volume and Momentum Indicators: Alongside
these patterns, traders often use volume and
momentum indicators to validate the breakout.
Increased volume and strong momentum
readings during a breakout lend credence to the
continuation of the trend.
•
Risk Management: Entry points based on these
patterns should always be coupled with sound
risk management strategies, like setting stop-loss
orders just outside the pattern. This helps in
mitigating potential losses if the breakout doesn't
lead to trend continuation.
Incorporating these chart formations into trend-
following strategies offers a structured approach to
identifying entry points. It's not about predicting the
next market move, but about recognizing and
acting on established patterns that historically have
indicated favorable entry moments.
Embracing a Trend-Following Mindset
This article has explored the vital distinction between
trend following and trend reversal strategies in
trading. While the lure of capturing a trend reversal
is understandable, it's fraught with high risks and
requires a level of expertise and market
understanding that is challenging for new traders.
On the other hand, trend following offers a more
structured and manageable approach. By adhering
to the three rules of trend following—waiting for the
trend to begin, jumping on the trend, and taking
profits at the right time—traders can navigate the
markets more effectively. Tools like the Bulls 'n Bears
indicator simplify this process, providing clear visual
cues for market trends.
As traders, especially those new to the markets, it's
imperative to focus on strategies that align with your
skill level, risk tolerance, and psychological makeup.
Embracing a trend-following mindset does not
guarantee success, but it does provide a framework
for making informed, disciplined decisions. The key is
continuous learning and adapting.
I encourage readers to dive deeper into the world of
technical analysis, exploring various market
indicators and chart patterns. Experiment with
simulated trades to gain experience and confidence.
Remember, in trading, there is no one-size-fits-all
strategy. The journey to becoming a successful trader
is personal and unique, but it always starts with a
solid foundation and a commitment to learning and
growth.
Bulls ‘n Bears: Working in combination with other tools, such as the CMF, traders use the Bulls ‘n
Bears to provide a visionary look at a markets bullish, bearish and neutral accumulation levels.
TrackNTrade.com
Disclaimer: There is a chance of loss when trading Stocks, Futures and Options.
See full risk disclosure online at: PitNews.com/risk.htm Copyright © PitNews Press, Inc.
Page: 11
Glossary
1.
Trend Following: A trading strategy that
involves identifying and taking positions in the
direction of prevailing market trends. It's
characterized by patience in waiting for a trend
to establish and then capitalizing on it until signs
of reversal appear.
2.
Trend Reversal Trading: A strategy that
attempts to predict points where the market's
existing trend will change direction. It's often
associated with high risk and requires significant
skill and experience.
3.
Market Momentum: The concept refers to the
strength or speed of a market trend. In trading,
momentum strategies aim to capitalize on the
continuation of existing trends in the market.
4.
Volume Indicators: Tools used in technical
analysis to understand the trading activity of a
stock or market. Volume can help confirm
trends and signal the strength of a particular
price movement.
5.
Momentum Indicators: These are technical tools
used to assess the speed or rate of change in the
prices of a market. They help traders identify
overbought or oversold conditions.
6.
Risk Management: The process of identifying,
assessing, and controlling threats to a trader's
capital and earnings. It includes setting stop-loss
orders and managing position sizes.
7.
Psychological Impact of Trading: Refers to the
emotional aspects of trading, such as the stress,
excitement, or frustration that can influence
decision-making.
8.
Economic Indicators: Statistics and data used to
gauge the overall health of the economy, which
can significantly influence market trends and
trading strategies.
9.
Market Sentiment: The overall attitude of
investors towards a particular market or asset.
It's a significant driver of market trends and a
key consideration in both trend following and
reversal strategies.
10.
Stop-Loss Order: An order placed with a broker
to buy or sell once the stock reaches a certain
price. It's designed to limit an investor's loss on a
trading position.
11.
Trailing Stops: A type of stop-loss order that
moves with the market price and is designed to
protect gains by enabling a trade to remain
open and continue to profit as long as the price
is moving in the trader's favor.
12.
Fibonacci Neutral Zone: A range within
Fibonacci retracement levels (specifically
between 38.2% and 61.8%) that signals a neutral
market condition.
Lan Turner teaches finance at Utah Tech University,
and is the editor-in-chief of PitNews Magazine.
PITNEWS MAGAZINE
www.PitNews.com


Disclaimer: There is a chance of loss when trading Stocks, Futures and Options.
See full risk disclosure online at: PitNews.com/risk.htm Copyright © PitNews Press, Inc.
Page: 12

The Fibonacci Effect
Now on Amazon!

Lan Turner’s Stock Market
Playbook of Strategies


•
Gain Discipline and Courage
Through Knowledge & Strategy.
A 238-page workbook. Your manual to
the stocks, futures, and options markets.


1
2
3
4
5
6
7
8
9
10
11
12
Across
5.
Author of Hidden World of Prop Firms?
7.
Author of Wall Streets Puppet Masters?
8.
Author of The Trend is Your Friend?
10.
The state where Claire lives?
11.
What trades at the CBOT?
12.
Where Dr. Scott Brown lives?
Down
1.
Author of Big Macs & Beyond?
2.
Where stocks are traded?
3.
The state where Aiden Gray lives?
4.
Who are the Puppet Masters?
6.
The state where Lan lives?
9.
City of the CME?


Disclaimer: There is a chance of loss when trading Stocks, Futures and Options.
See full risk disclosure online at: PitNews.com/risk.htm Copyright © PitNews Press, Inc.
The Puppet Masters of Wall Street:
Unmasking the Art of Market Manipulation


by Claire Kristensen
In the world of finance, knowledge is power, but
what if the game is rigged from the start? Welcome
to the intricate maze of market manipulation, a
realm where large speculators like hedge funds and
big banks pull the strings, and retail traders often
find themselves dancing to a tune they didn't choose.
Understanding the tactics used to manipulate the
market is not just a skill; it's a necessity for survival in
this high-stakes environment.
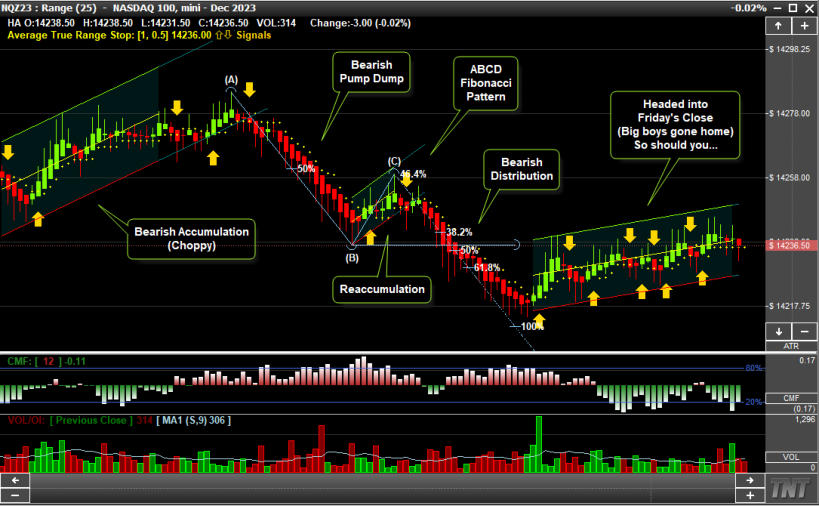
One of the most telling signs of market manipulation
is a recurring price pattern that can be best
described as a "pump 'n dump" strategy. This
pattern is like a siren's song, luring in unsuspecting
traders with the promise of high returns, only to
leave them stranded when the tide turns. By the end
of this article, you'll not only be able to identify this
deceptive pattern but also understand the
mechanics behind it, empowering you to navigate
the treacherous waters of market manipulation.
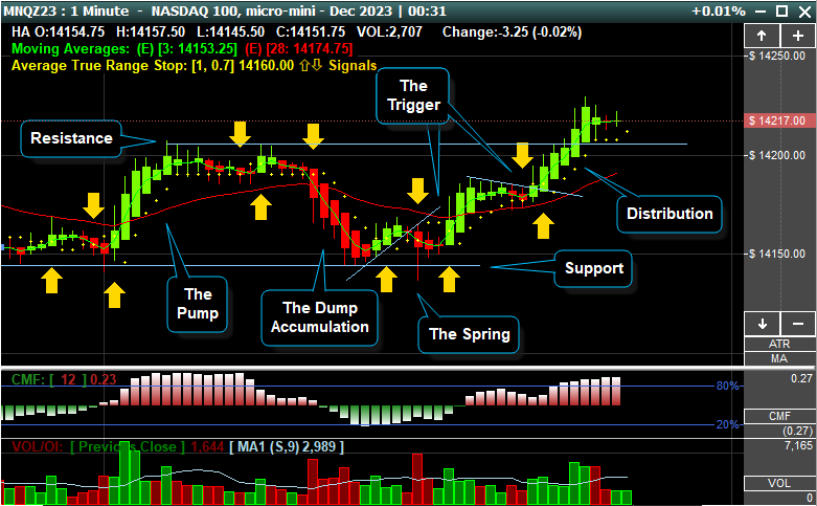
The Pump 'n Dump Strategy
In the trading lexicon, the term "pump 'n dump" has
gained notoriety for being a manipulative tactic
that plays out like a well-orchestrated drama.
Picture this: the market starts to rally, showing strong
bullish trends after a period of sluggish movement. If
you're using Heiken-Ashi bars, you'll notice a series of
flat-bottom green bars, often spanning four to eight
bars, painting a picture of a market ripe for the
picking. This sudden surge is the "pump," and it's
Page: 14
Disclaimer: There is a chance of loss when trading Stocks, Futures and Options.
See full risk disclosure online at: PitNews.com/risk.htm Copyright © PitNews Press, Inc.
designed to set off every alarm bell on traders'
market scanners. It's like a flare shot into the night
sky, impossible to ignore and incredibly enticing.
Now, who's behind this grand spectacle? Enter the
large banks and hedge funds, the puppet masters of
this strategy. Their objective is simple yet cunning: to
attract as many eyeballs and, consequently, as much
trading volume as possible. Remember, trading is a
zero-sum game. For every buyer, there needs to be
a seller, and vice versa. These large speculators need
retail traders to sell to them when they want to buy
and to buy from them when they want to sell. The
pump serves as the bait, luring in small speculators
who think they're about to ride a bullish wave to
riches.
The pump 'n dump is not just a random occurrence;
it's a calculated move by these financial giants. They
know that the sudden uptick in market activity will
draw traders like moths to a flame. And once
they've got enough people on the hook, they're
ready for the next phase of their strategy, which
we'll delve into shortly.
By understanding the mechanics of the pump 'n
dump, you're not just learning to identify a pattern;
you're peeling back the curtain on how large
financial institutions operate in the shadows,
manipulating market conditions to serve their
interests.
The Wyckoff Spring
In the grand theater of market manipulation, the
Wyckoff Spring is the plot twist that even seasoned
traders often fail to anticipate. Named after Richard
Wyckoff, a pioneer in the study of market behavior,
the Wyckoff Spring is a technical pattern that serves
as the linchpin in the large speculators' strategy. It's
the moment when the curtain lifts, revealing the
true intentions of the market's puppet
masters—large banks and hedge funds.
Imagine you've just witnessed the pump, that bullish
surge that had you and countless other traders
excitedly entering the market. Now, suddenly, the
market takes a nosedive, plummeting back down to
test the lows of the initial pump. Often, it will even
Page: 15
TrackNTrade.com
Disclaimer: There is a chance of loss when trading Stocks, Futures and Options.
See full risk disclosure online at: PitNews.com/risk.htm Copyright © PitNews Press, Inc.
break below those lows. This is the Wyckoff Spring in
action, and it's where the large speculators start
accumulating their positions. They're buying up
shares or contracts at rock-bottom prices, often
signaled by large volume spikes. It's like a clearance
sale for them, and they're filling their carts.
Now, what about the retail traders who got caught
in this whirlwind? This is where the trap snaps shut.
As the market tumbles, panic sets in. Retail traders
start to bail, selling off their positions in a frantic bid
to cut their losses. They're jumping ship just as the
large speculators wanted them to, providing these
financial giants with the liquidity they need to
accumulate massive positions at bargain prices. It's a
classic case of the big fish eating the small fish.
The Wyckoff Spring is not just a point of
accumulation for large speculators; it's a well-laid
trap designed to shake out retail traders. Those who
fall for it find themselves selling at the worst possible
time, right when the large players are buying. It's a
harsh lesson in market dynamics, teaching traders
that what goes up can come crashing down,
especially when large speculators are pulling the
strings.
The Real Pump
After the dust settles from the Wyckoff Spring, the
stage is set for the grand finale—the real pump. If
the initial pump was the opening act, a mere sleight
of hand to divert your attention, then the real pump
is the main event. It's the moment when large
Accumulation Phase Unveiled: Contrasting the market's bullish sentiment, the declining CMF
values on this chart reveal the accumulation of the big players, warning of a possible forthcoming rise.
Page: 16
TrackNTrade.com
Disclaimer: There is a chance of loss when trading Stocks, Futures and Options.
See full risk disclosure online at: PitNews.com/risk.htm Copyright © PitNews Press, Inc.
speculators, now armed with a colossal position built
during the fake-out, prepare to make their killing.
Picture this: The market suddenly springs back to
life, and this time, it's not a mirage. Large Heiken-
Ashi bars with pristine flat bottoms start to populate
the chart. It's as if the market has been given a shot
of adrenaline, and it's racing upward with a
newfound vigor. Retail traders, still nursing their
wounds from the earlier fake-out, see this as a
second chance. Like moths to a flame, they swarm
back into the market, buying into what they believe
will be a monumental uptrend. And this time,
they're not wrong; the market does soar. But there's
a catch.
Here's the twist: As retail traders buy into the rising
market, the large speculators begin to unload their
massive positions. They're selling into the buying
frenzy, offloading their shares or contracts at
premium prices. It's a masterstroke, a coup de
maître. They've not only managed to buy low during
the Wyckoff Spring but are now selling high during
the real pump. The profits are astronomical, and
they've managed to play both sides of the market to
perfection once again.
The real pump is the crescendo in this orchestrated
symphony of market manipulation. It's where large
speculators cash in on their well-executed strategy,
leaving retail traders to wonder how they got
played—again. The irony is that the retail traders are
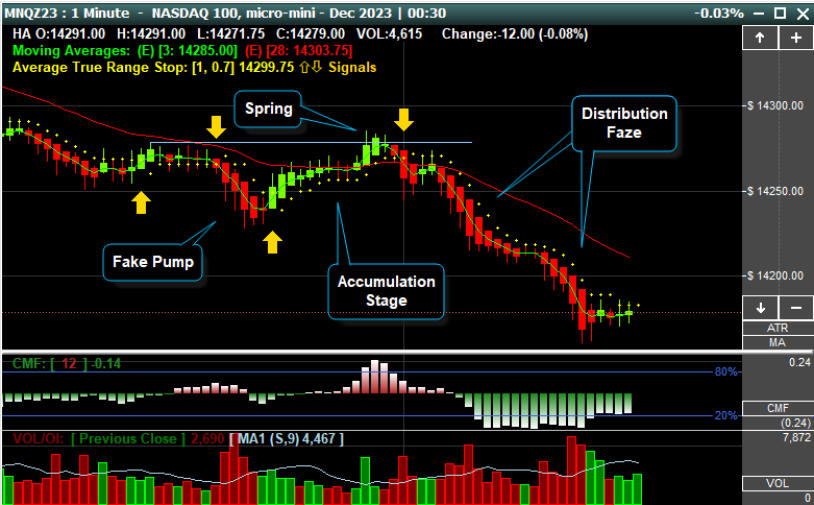
Rising Accumulation Stage: As the market dips, we notice a dip in the CMF indicator, suggesting that
large players are building positions and setting the stage for a potential flush.
Page: 17
TrackNTrade.com
Disclaimer: There is a chance of loss when trading Stocks, Futures and Options.
See full risk disclosure online at: PitNews.com/risk.htm Copyright © PitNews Press, Inc.
not entirely wrong; the market did make a
significant move. But it's the large speculators who
reap the lion's share of the profits, having
manipulated the market to serve their ends at every
turn.
This is the harsh reality of trading in a market where
large speculators hold the reins. They set the tempo,
and if you're not careful, you'll find yourself dancing
to their tune, often to your detriment.
The Role of the CMF Indicator
In this intricate game of cat and mouse between
large speculators and retail traders, one might
wonder if there's a way to level the playing field.
Enter the Chaikin Money Flow (CMF) indicator, a
tool that can serve as your radar in the murky
waters of market manipulation. Named after its
creator, Marc Chaikin, the CMF indicator is designed
to reveal the market's hidden currents—specifically,
the phases of accumulation and distribution that
large speculators so skillfully navigate.
Imagine the CMF as a gauge that measures the
pulse of the market. When the indicator shows a
negative value, it's a sign that the market is in an
accumulation phase. This is where large speculators
are quietly building their positions, often at the
expense of retail traders. On the flip side, a positive
value on the CMF indicates a distribution phase. This
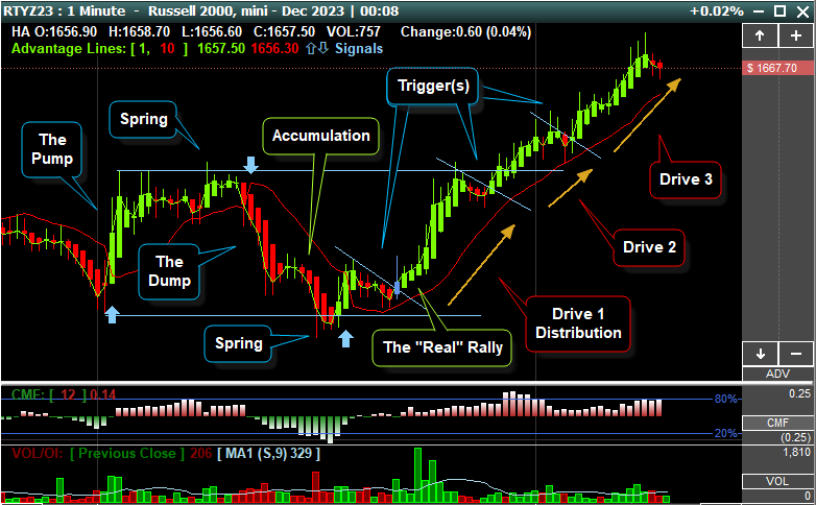
Accumulation Phase Identified: This chart shows a period of quiet accumulation, as evidenced by
the subtle yet sustained decrease in the CMF indicator, hinting at the stealthy buying activity of large
speculators before a market rally.
Page: 18
TrackNTrade.com
Disclaimer: There is a chance of loss when trading Stocks, Futures and Options.
See full risk disclosure online at: PitNews.com/risk.htm Copyright © PitNews Press, Inc.
is the moment when large speculators are offloading
their holdings, usually into the eager hands of retail
traders who are buying into what they believe is an
uptrend.
The beauty of the CMF indicator lies in its simplicity.
It cuts through the noise and shows you what's really
happening beneath the surface. By keeping an eye
on the CMF, you can get a sense of when large
speculators are likely accumulating or distributing
their positions. This knowledge can be invaluable,
allowing you to align your trading strategy with the
market's true movers and shakers, rather than
getting caught in their traps.
So, how can you use the CMF to your advantage?
When you see the CMF trending downwards during
a market pullback, it could be a sign that large
speculators are accumulating. This is your cue to
consider entering the market, but with caution and
proper risk management. Conversely, if the CMF is
trending upwards during a market rally, be wary.
The big players might be distributing, and the so-
called uptrend could be a facade.
In essence, the CMF indicator serves as your compass,
helping you navigate the treacherous yet potentially
rewarding landscape of market manipulation. By
understanding the phases of accumulation and
distribution, you can trade more strategically,
sidestepping the pitfalls that ensnare many retail
traders.
The Language of the Market
In the world of trading, knowledge is power, but
perspective is everything. While retail traders often
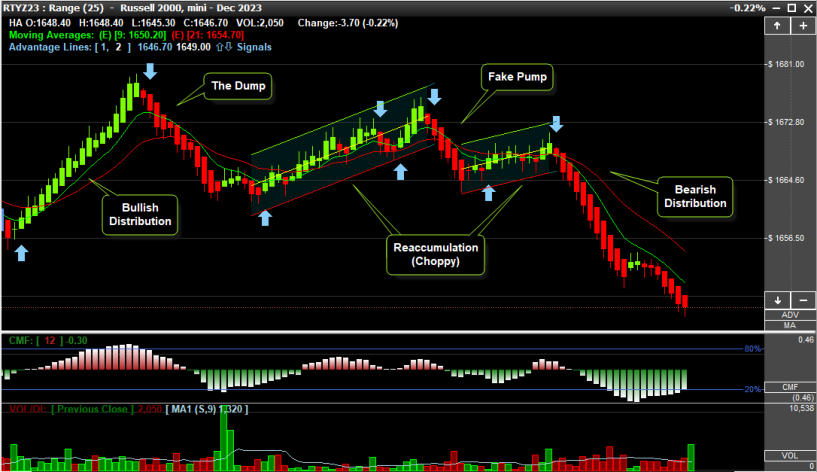
Choppy Reaccumulation: This chart captures the explosive growth potential (Distribution) after a
choppy accumulation stage, where large speculators begin to accumulate in anticipation of a sell-off.

Page: 19
TrackNTrade.com
Disclaimer: There is a chance of loss when trading Stocks, Futures and Options.
See full risk disclosure online at: PitNews.com/risk.htm Copyright © PitNews Press, Inc.
view the market through the lens of indicators,
charts, and news, the real puppet masters—large
hedge funds and banks—see it as a playground for
their strategic maneuvers. Understanding the
market from their vantage point isn't just an exercise
in empathy; it's a crucial strategy for survival and
success.
Think of the market as a grand chessboard. In this
high-stakes game, large hedge funds are the
grandmasters, always several moves ahead. They
don't react to the market; they create the market
conditions that cause reactions. If you want to
elevate your trading game, you need to start
thinking like them. But how can you adopt the
mindset of a large hedge fund manager?
Here are some tips to help you think like a large
hedge fund manager:
1.
Look for Volume: Large players can't hide their
tracks; they leave clues in the form of trading
volume. High volume during a market move
can indicate their involvement.
a.
Always remember that large speculators
need liquidity to execute their strategies.
They need sellers when they're buying and
buyers when they're selling. Your first clue to
their intentions often lies in sudden,
unexplained market movements. These are
not random events; they're carefully
orchestrated to attract attention and
generate liquidity.
Post-Pump CMF Downtrend: Here, the CMF indicator begins to fall despite continued choppy
upward market movement, signaling that the rally might be on borrowed time, with large speculators
exiting their positions.

Page: 20
TrackNTrade.com
Disclaimer: There is a chance of loss when trading Stocks, Futures and Options.
See full risk disclosure online at: PitNews.com/risk.htm Copyright © PitNews Press, Inc.
2.
Understand Market Psychology: Large
speculators know how to exploit emotions like
fear and greed. Be aware of your own
emotional triggers and try to stay neutral.
a.
Be skeptical of market 'noise.' Large hedge
funds are masters of deception. They'll
pump up a stock to lure you in, only to pull
the rug from under you once they've
accumulated enough shares. Always
question the motive behind a sudden price
movement. Is it a genuine trend or a trap?
3.
Follow the Money: Use indicators like the CMF
to identify where the money is flowing. Is it an
accumulation or distribution phase? Adjust your
strategy accordingly.
a.
Use tools that give you insights into their
activities. We've already discussed the
Chaikin Money Flow indicator, but there are
others like the Volume Profile, Bulls ‘n Bears,
MACD, Stochastics, and RSI that can provide
valuable clues.
4.
Be Patient: Large hedge funds don't make
impulsive moves. They plan and execute their
strategies over longer time frames. Don't rush
into trades; let the opportunities come to you.
a.
Practice patience and discipline. Large
hedge funds don't jump on every
opportunity; they wait for the perfect setup
that aligns with their strategy. Adopt a
similar approach. Wait for confirmations,
manage your risks, and most importantly,
stick to your trading plan.
5.
Risk Management: This is a cornerstone of any
successful trading strategy, but it's especially
crucial when you're trying to navigate a market
that's being manipulated. Always have a clear
exit strategy.
By understanding the language of the market from
the perspective of its most influential players, you're
not just leveling the playing field; you're turning it in
your favor.
The Other Side of the Coin: When Even Giants
Stumble
It's crucial to acknowledge that even the titans of
trading—the large banks and hedge funds—are not
infallible. There are instances where their well-
calculated strategies backfire. They may pump the
market, accumulate a significant number of shares,
and aim for another market run, only to find that
the retail traders they rely on aren't biting the bait
this time.
In such scenarios, even these large institutions can get
caught holding the bag, stuck with positions they
can't offload at a profit. This serves as a stark
reminder that no strategy is foolproof, not even
those employed by the market's most influential
players.
Risk Management: Your Safety Net
Given this reality, it's imperative to exercise good
judgment and employ robust risk management
strategies. Protective stops are not just optional; they
are essential. They serve as your safety net,
minimizing losses when even the most promising of
strategies fail, whether you're a retail trader or a
large institution.
Conclusion
In the intricate dance of the financial markets,
understanding the choreography of large speculators
is not just a skill; it's a necessity. From the deceptive
allure of the pump 'n dump to the cunning trap of
the Wyckoff Spring, the market is rife with strategies
designed to lure retail traders into positions that
ultimately benefit the big players. But as we've
journeyed through the dark arts of market
manipulation, I hope you've gleaned that you're far
from powerless.
The key to not just surviving but thriving in this
environment is awareness. By recognizing the signs of
manipulation and understanding the strategies
employed by large banks and hedge funds, you can
turn what seems like a rigged game to your
advantage. Tools like the CMF indicator can serve as
your compass, helping you navigate the treacherous
waters of accumulation and distribution phases. And
by adopting the mindset of a large hedge fund
manager, you can elevate your trading strategy
from reactive to proactive.
Page: 21
Disclaimer: There is a chance of loss when trading Stocks, Futures and Options.
See full risk disclosure online at: PitNews.com/risk.htm Copyright © PitNews Press, Inc.
Page: 22
So, as you go forth in your trading endeavors, I
encourage you to apply this newfound knowledge.
Don't just be another pawn in the market; be a
player who understands the rules of the game and
knows when to make the right moves. Equip
yourself with the tools and mindset to not just
identify but capitalize on the market's manipulative
tactics.
Remember, the market speaks a language, and it's
one that you can learn. By doing so, you're not just
trading; you're trading smartly, strategically, and
with the kind of insight that can transform your
financial future.
Claire Kristensen is a part time futures trader and
stock investor living in Las Vegas Nevada. She’s a
member of Lan Turner’s President’s Club, and a
contributing writer to PitNews Magazine.

In the intricate dance of the financial
markets, understanding the
choreography of large speculators is
not just a skill; it's a necessity.
-- Claire Kristensen

Ready to take your trading to the next level?
Dive into Track 'n Trade with a free trial.

Track ‘n Trade LIVE Stocks & Futures
The Ultimate STOCKS, FUTURES & OPTIONS Live Trading Platforms
Live Trading Platforms For The Visual Investors


www.TrackNTrade.com

Disclaimer: There is a chance of loss when trading Stocks, Futures and Options.
See full risk disclosure online at: PitNews.com/risk.htm Copyright © PitNews Press, Inc.

By Scott Brown, Ph.D.
The Big Mac Index reflects broader economic
principles around inflation and purchasing power
that directly impact stock and futures markets.
Published by The Economist since 1986, it compares
the prices of McDonald's signature burgers across
countries as an informal measure of purchasing
power parity (PPP) between currencies.
At its core, the index is built on the theory that
exchange rates should equalize the cost of an
identical basket of goods internationally. This
connects to inflation—as prices and currencies
fluctuate over time, inflation rises when a currency
depreciates relative to the goods and services it can
buy. The Big Mac's near-universal availability and
standardization makes it a useful proxy for overall
consumer pricing.
Tracking the index highlights discrepancies between
currencies' implied and actual exchange rates.
Currencies overvalued per the Big Mac have greater
purchasing power parity than currency exchanges
indicate, while undervalued currencies have lower
comparative purchasing power. As an
internationally ubiquitous product, it reflects the
inputs that drive broader inflation in a given
Big Macs & Beyond: Exploring the Impact on
Stocks, Futures and Bonds
Page: 24
Disclaimer: There is a chance of loss when trading Stocks, Futures and Options.
See full risk disclosure online at: PitNews.com/risk.htm Copyright © PitNews Press, Inc.
economy—ingredient prices, labor costs, rent,
advertising expenses.
These forces directly shape corporations'
fundamentals and impact share prices. Rising
inflation and input costs pressure profit margins,
lowering earnings potentials and typically stock
valuations. However, the level of inflation that
maximizes stock returns varies historically and across
sectors. Additionally, attempts by central banks
worldwide to curb rising consumer prices through
interest rate hikes deliberately slow economic
growth—with mixed impacts on equities.
The futures market provides tools for investors to
hedge risks and speculate on inflation's trajectory.
Inflation-linked bond futures allow traders to bet on
inflation-adjusted returns and offer information on
real interest rates. Stock index futures track
benchmarks responding to inflation and can protect
against or take advantage of price declines.
Commodity futures like agricultural goods reflect
rising input costs facing firms.

So while originally semi-humorous, the humble Big
Mac Index encapsulates powerful monetary
dynamics. Tracking its national fluctuations provides
insights into inflation, currency valuations, and
purchasing power shifts with profound implications
for global equities, bonds, and futures. The costs of
ingredients, labor, and real estate driving modest
fast food pricing offer surprising utility for modeling
broad economic trends, risks, and opportunities.
Why Is Lee Massachusetts Home to the Most
Expensive Big Mac in America?
A photo recently went viral on Reddit showing a
McDonald's menu with a Big Mac meal priced at
$7.59, reportedly the highest in the nation. While fast
food lovers gawked at the costly burger, it prompted
questions about the reasons for vastly different
franchise pricing across the country.
McDonald's states that pricing is determined at the
restaurant level by franchisees and can shift
depending on location. The same goes for chains like
Burger King and Dunkin'. Under Massachusetts law,
businesses can set prices as they see fit as long as they
properly advertise the correct amounts. Franchise
consultants point to an array of factors owners weigh
when calculating costs.
“For pricing structure in a restaurant, you have basic
food cost, cost of goods sold, which includes labor,”
said John Adams, who has held various roles assisting
Domino’s franchisees in New York. “These are used to
determine the price of a product that's being sold."
Mr. Adams explains that food costs are typically
marked up between 2.5 to 5 times for menu items.
So while standards around ingredients and
preparation exist for franchises, pricing tends to vary.
He cites differences in regional expenses as the main
Page: 25
Disclaimer: There is a chance of loss when trading Stocks, Futures and Options.
See full risk disclosure online at: PitNews.com/risk.htm Copyright © PitNews Press, Inc.
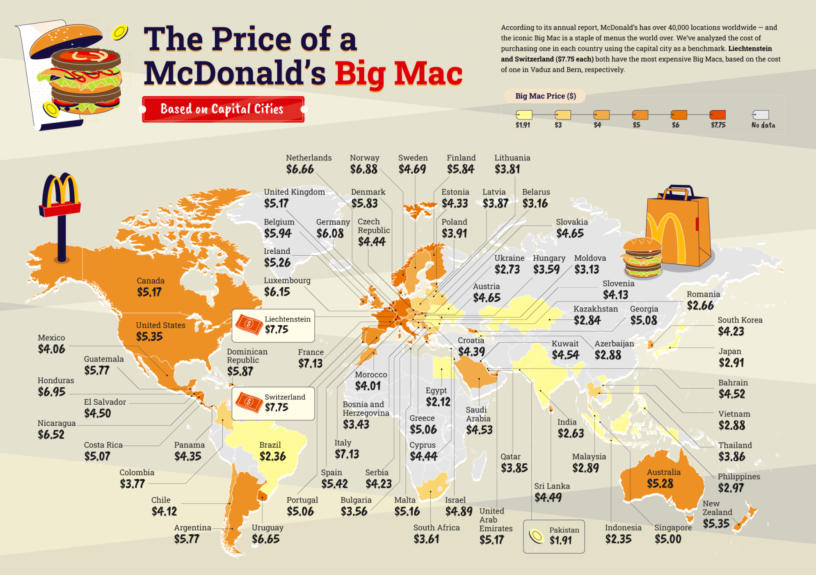
reason the Big Mac named after Massachusetts sells
for almost $8, far above the national average of
$5.35.
“The pricing is directly related to the cost of the
product that they're selling,” Mr. Adams said.
“Leasing costs play the largest role in pricing.”
The adage in real estate applies to fast food too —
location dictates price. A roadside McDonald's off the
Mass Pike in the rural town of Lee faces substantially
lower overheads than city spots. So while the taste of
a Big Mac might hold universal, its monetary value
proves anything but.
The Reddit post showcasing a $7.59 Big Mac meal
can be seen as an attempt to exaggerate the extent
of inflation, attributing a broader significance to a
singular data point. By emphasizing the price and
claiming it as the "highest in the nation," the post
implies a widespread issue, fostering the perception
that inflation significantly impacts fast-food prices.
The use of the term "viral" further amplifies the post's
reach, contributing to its credibility.
However, the lack of contextual information, such as
regional factors or franchisee decisions, undermines
the post's validity. Ultimately, the consumer reactions
fueled by emotional responses on social media may
reinforce an exaggerated narrative about inflation,
highlighting the importance of individual
responsibility in critically evaluating and reasoning
through news and information.
Figure 1: Global Appetite, Local Prices: Mapping the Average Cost of a Big Mac Around the World
Page: 26
Disclaimer: There is a chance of loss when trading Stocks, Futures and Options.
See full risk disclosure online at: PitNews.com/risk.htm Copyright © PitNews Press, Inc.
The Psychology of Economic Pessimism: Why Good
News Falls on Deaf Ears
This attempt to stir outrage on social media taps into
the persistent gap between public economic
perceptions and reality. Despite clear evidence of
moderating inflation, many citizens believe the
economy remains dire.
Nobel Laureate Krugman argues this reveals how
partisanship can outweigh facts in shaping
sentiments. With unemployment nearing record
lows, surveys showing negative views, particularly
among Democrats, suggest partisan identity is
driving opinions more than personal finances.
Additionally, the heavy focus by the media on
economic troubles despite positive indicators
contributes to this disconnect. Ultimately, the notion
that people's perceptions closely align with their
actual economic experiences is challenged.
Many seem unwilling to acknowledge moderating
prices, clinging to inflation as a defining economic
issue regardless of the data. In Krugman's view, this
affliction of disinflation sits squarely at the
intersection of partisan politics, media coverage, and
the human tendency to emphasize the negative
over the positive.
The result is an unwarranted sense of pessimism
impervious to genuinely encouraging developments.
- Dr. Scott Brown
Editor’s Note: As we wrap up this discussion on
economic perceptions and the factors influencing
them, I encourage you to dive even deeper into the
world of economic analysis with Dr. Scott Brown. You
can explore Dr. Brown’s books and courses online at:
www.DrScottBrown.com.
Expand your knowledge and understanding by
exploring Wealth By Design, available at
https://linktr.ee/scottbrownphd. Dr. Brown's expertise
provides valuable insights that can empower you to
navigate the complexities of the economy and make
informed decisions. Take the next step in your
learning journey to gain a deeper appreciation of
economic dynamics. Your journey to economic
enlightenment begins with a single click – don't miss
out on this opportunity to enhance your
understanding and to stay informed.
Dr. Brown’s Book: Wealth By Design, with Co-
Author Daniel Hall
Page: 27

Trade LIVE With Lan Turner
Unlock the Secrets of Day Trading with Real-Time Strategies and Insights
Join Lan Turner every Monday through Thursday as he explores the intricacies of
day trading in real-time. We kick off each morning session at 9:25 AM Eastern
Time, 7:25 AM Mountain, right at the stock market's opening bell. Don't miss this
opportunity to enhance your trading skills and strategies!
Topics Covered:
•
Fibonacci Sequences
•
Elliott Wave Theory
•
Heiken-Ashi Bar Trading
•
Momentum and ATR
•
Bulls 'n Bears Strategies
•
Stop Entry and Exit Techniques
•
Market Patterns
•
Risk Management
...and much more!
Subscribe to our YouTube Channel today
and never miss another live session!
YouTube.com/TradeMentors

Starts
9:25 AM Eastern
M-T-W-T-F

Page: 28


Disclaimer: There is a chance of loss when trading Stocks, Futures and Options.
See full risk disclosure online at: PitNews.com/risk.htm Copyright © PitNews Press, Inc.
by Lan Turner
As a traders, we’re gripped by the elusive nature of
profits in the financial markets. There's an old saying
that resonates with me: "Profits are a trader's best
friend, yet they're as elusive as a shadow." This
perfectly sums up the allure and challenge of
securing profits in the ever-shifting landscape of
trading. In my experience, one concept that stands
out in this pursuit is the "Profit Box."
The Profit Box is a metaphorical space defined by
the entry and exit points of a trade. It's generally
shaped by the use of mathematical models and
technical indicators; essentially, it represents the
limited profit zone we traders navigate. It's like
being in a race where you're constantly trying to
Navigating the Profit Box:
The Art and Strategy of Scalp ‘n Trail


catch up – entering a bit too late and exiting a bit
too soon. This space, the Profit Box, is a double-
edged sword: it offers the potential for gain, but also
poses the risk of reduced returns due to these late
entries and early exits.
Through my many years as a trader, I've realized
how crucial it is to understand this concept. Relying
solely on lagging indicators such as Parabolic SAR,
ATR, or moving averages can often lead to missed
opportunities. These tools are valuable, but they
tend to signal entry or exit points after the market
has already started its move. This delay in entry is
what creates the Profit Box dilemma – a narrowed
window for potential profits.
Page: 29
Disclaimer: There is a chance of loss when trading Stocks, Futures and Options.
See full risk disclosure online at: PitNews.com/risk.htm Copyright © PitNews Press, Inc.
In this article, I'll take you through my own strategies
and insights into maximizing gains within the
constraints of the Profit Box. It's a fine line between
risk and reward, and navigating it successfully
requires not just skill, but a deep understanding of
the market's nuances. For traders like us, turning the
elusive shadow of profits into a tangible reality is not
just about the numbers; it's about understanding the
rhythm and flow of the markets. Let's explore
together how to master this art form in the world of
trading.
Understanding the Profit Box; Definition and
Explanation of the Profit Box
At its core, the Profit Box is a trading concept that
encapsulates the potential profit zone bounded by
the points of entry and exit in a trade. This zone is
directly influenced by the time delay inherent in
using technical indicators, which often results in a
trader entering the market after a trend has started
and exiting once the trend has begun to reverse. This
delayed reaction shrinks the potential profit window,
thus creating what we refer to as the "Profit Box."
The Profit Box isn't just a theoretical construct; it's a
practical reality that impacts every trade. It's where
the theoretical maximum profit, as predicted by
models and indicators, meets the practical
limitations of real-world trading.
Lagging Indicators Create the Profit Box
Lagging indicators play a pivotal role in the
formation of the Profit Box. These indicators, such as
the Moving Average, Parabolic SAR (Stop and
Reverse), and Average True Range (ATR), are
designed to confirm trends based on historical data.

Page: 30
The Profit Box: The Profit Box is the small area of opportunity between where you enter the market
and where you exit. Pre-box is the Hors d’oeuvres, while the post box is our dessert.
Disclaimer: There is a chance of loss when trading Stocks, Futures and Options.
See full risk disclosure online at: PitNews.com/risk.htm Copyright © PitNews Press, Inc.
However, the very nature of relying on past data
means that these indicators inherently lag behind, as
they require real-time market movements to make
their predictions.
When a lagging indicator signals an entry point, the
market may have already moved significantly,
meaning the trader misses out on the initial profit
opportunity. Similarly, exit signals may come too
late, leaving the trader clinging to a diminishing
profit or, in worse cases, facing a reversal into loss
territory. Therefore, the Profit Box is the time that
the trader has to maximize gains within a
constrained environment, which is formed by the lag
time between the entry and exit points.
Moving Average Profit Box in Action
To bring the concept of the Profit Box to life,
consider the scenario of a trader using a simple
moving average crossover strategy. When the short-
term moving average crosses above the long-term
average, it’s considered a buy signal. However, by
the time this crossover is confirmed, the market
might have already moved substantially. The trader,
entering at this point, is now operating within a
Profit Box, where the potential for gain is reduced
compared to an earlier entry.
Another example can be seen in volatile markets. A
trader using ATR to set stop-loss orders might find
Page: 31
Disclaimer: There is a chance of loss when trading Stocks, Futures and Options.
See full risk disclosure online at: PitNews.com/risk.htm Copyright © PitNews Press, Inc.
themselves stopped out of a profitable trade
prematurely due to the lag in ATR adjusting to
sudden market changes. Here, the Profit Box is
defined by the distance between the entry point and
the premature exit point, constrained by the lagging
nature of the indicator.
Understanding the Profit Box is essential for traders
to develop strategies that not only recognize this
constrained space but also employ tactics to
optimize trading within it, thus maximizing their
potential profits.
Strategies to Overcome the Profit Box Dilemma
Navigating the Profit Box effectively requires
strategic thinking and a toolkit of various trading
approaches. Here, we explore several strategies that
can help traders maximize their gains within the
confines of the Profit Box, along with the pros and
cons of each approach.
Avoiding Non-Trending Markets
•
Strategy: This involves staying out of markets
that lack a clear trend. Non-trending markets
lead to very small, or negative (losing) Profit
Boxes.
•
Don’t continually try to capture every new
breakout of a dead market, this is death by a
thousand small cuts to a traders account.
Scalping for Smaller Profits
•
Strategy: Scalping is a technique where traders
aim for small profit margins in short-term trades,
often exiting the trade within minutes. Traders
enter the profit box, but exit prior to the reversal
signal based on predetermined price levels when
to exit.
•
Pros: Allows traders to capitalize on small
market movements; less exposure to long-term
market risks.
•
Cons: Requires constant market monitoring and
quick decision-making; transaction costs can
accumulate, impacting overall profit.
Exiting Trades Before Reversals
•
Strategy: This involves exiting a trade before
indicators signal a reversal, gauging through
predetermined profit targets, experience,
liquidity, volume, recurring price patterns or
other types of exit strategies.
•
Pros: Minimizes the risk of holding a position into
a losing trend; allows for more controlled and
planned exits.
•
Cons: Potentially leaving money on the table if
the market continues to trend favorably after
exit.
Combining Mathematical and Trendline Approaches
•
Strategy: Using a blend of mathematical models
(like moving averages) and trendline analysis to
make entry and exit decisions.
•
Pros: Provides a more holistic view of the
market; can validate signals from one method
with the other.
•
Cons: Requires deeper market understanding
and experience; may result in conflicting signals.
Using Trailing Stop Orders
•
Strategy: Implementing trailing stops to
automatically adjust the stop-loss level as the
market moves favorably.
•
Pros: Locks in profits while allowing the trade to
run during favorable trends; reduces emotional
decision-making.
Page: 32
Disclaimer: There is a chance of loss when trading Stocks, Futures and Options.
See full risk disclosure online at: PitNews.com/risk.htm Copyright © PitNews Press, Inc.
•
Cons: In highly volatile markets, a trailing stop
might be hit prematurely, exiting the trade
before maximum profits are realized.
Employing Additional Technical Indicators
•
Strategy: Using a combination of different
technical indicators to confirm trade signals.
•
Pros: Increases the reliability of trade signals;
provides a more comprehensive market analysis.
•
Cons: Can lead to analysis paralysis where
conflicting indicators make decision-making
difficult; risk of overcomplicating the trading
strategy.
Each of these strategies offers a way to navigate the
Profit Box more effectively. However, it's crucial for
traders to understand their own risk tolerance,
trading style, and the specific market conditions they
are operating in to choose the strategy that best suits
their needs. Combining these strategies thoughtfully
can lead to a more nuanced and successful trading
approach, allowing traders to maximize their
potential within the Profit Box.
Lan Turner's Strategy Solution: Scalp ‘n Trail
In my trading journey, I've developed a strategy I
call "Scalp ‘n Trail," a method that effectively
navigates the intricacies of the Profit Box. This

Page: 33
Disclaimer: There is a chance of loss when trading Stocks, Futures and Options.
See full risk disclosure online at: PitNews.com/risk.htm Copyright © PitNews Press, Inc.
strategy is a blend of swift profit-taking through
scalping, coupled with the strategic use of trailing
stops to maximize gains. Here, I'll share how this
approach helps me tackle the challenges posed by
the Profit Box.
My Unique Approach
"Scalp ‘n Trail" revolves around two key tactics:
securing quick, small gains through scalping and
leveraging trailing stops for longer-term trend
benefits. This strategy requires entering the market
with multiple positions, contracts in the futures
market shares in the stock market.
•
Scalping for Immediate Gains: My initial focus in
a trade is to scalp for immediate profits. This
tactic is particularly effective in markets where
the Profit Box is constricted due to factors like
high volatility or delayed entry signals from
lagging indicators. By quickly capturing small
profits, I reduce the risk of losing out on potential
gains due to market shifts. If I enter the trade
with two contracts, I liquidate one contract with
the scalp, and then let the other contract remain
active for the trail.
•
Employing Trailing Stops: After securing a profit
through scalping, I then switch to using trailing
stop orders. These stops adjust dynamically with
favorable market movements, allowing me to
remain in the trade and potentially capture
larger trends. This part of the strategy not only
maximizes the upside potential but also
safeguards the profits I've already secured. This is
done, through Track ‘n Trade by setting up an
Auto-Trailing Q-OCO order to trail to exit on the
ATR, PSAR, Price Bars Back PBB, or any number
of other trailing factors you may choose based on
your personal risk tolerance. Trailing too close
can result in getting stopped out prematurely,
trailing too far back can incur significantly larger
losses than necessary. Experience must dictate,
there is no right answer, only different outcomes
for each trade.
Overcoming the Profit Box Challenges
My "Scalp ‘n Trail" strategy directly addresses the
limitations of the Profit Box:
•
Maximizing Immediate Profit Opportunities: By
initially focusing on scalping, I mitigate the risk
associated with delayed market entries, ensuring
I capitalize on profit opportunities as soon as
they arise.
•
Expanding the Profit Potential: The trailing stop
aspect of the strategy allows me to capture
extended market trends, effectively enlarging
the Profit Box. This approach is crucial in
avoiding premature exits and in maximizing
profit from favorable market movements.
•
Incorporating Risk Management: A key benefit
of this strategy is its built-in risk management.
The scalping component potentially offers some
level of profit, while the trailing stops protect
these gains and minimize potential losses in case
of market reversals.

Page: 34
Disclaimer: There is a chance of loss when trading Stocks, Futures and Options.
See full risk disclosure online at: PitNews.com/risk.htm Copyright © PitNews Press, Inc.
•
Flexibility and Adaptability: "Scalp ‘n Trail" is
versatile and can be adapted to various market
conditions, making it a valuable strategy for
different trading environments.
Through "Scalp ‘n Trail," I've developed a
comprehensive method that not only acknowledges
the constraints of the Profit Box but also leverages
these limitations to optimize my trading outcomes
across various market scenarios.
Balancing Risk and Reward
In trading, the interplay between risk and reward is
a constant theme, and this is particularly evident
when navigating the Profit Box. Each strategy to
overcome the Profit Box dilemma comes with its
own set of risks and rewards. Additionally, the
psychological aspects of trading within this
framework play a crucial role in decision-making.
Analysis of Risks Involved with Each Strategy
•
Avoiding Non-Trending Markets
o
Risk: Missing out on potential profits from
market movements that initially appear
non-trending but eventually evolve into
clear trends.
o
Reward: Reduced exposure to false signals
and lower risk of losses in uncertain market
conditions.
•
Scalping for Smaller Profits

Page: 35
Disclaimer: There is a chance of loss when trading Stocks, Futures and Options.
See full risk disclosure online at: PitNews.com/risk.htm Copyright © PitNews Press, Inc.
o
Risk: High transaction costs and the potential
for significant losses due to the high volume
of trades. Requires intense focus and quick
decision-making.
o
Reward: Opportunity to capitalize on small,
frequent market movements, reducing
exposure to long-term market shifts.
•
Exiting Trades Before Reversals
o
Risk: Potential to exit a trade too early,
missing out on additional profits if the
market continues in a favorable direction.
o
Reward: Protects gains by avoiding market
reversals and mitigating the risk of turning a
profitable trade into a losing one.
•
Mathematical and Trendline Approaches
o
Risk: Complexity and potential for conflicting
signals, which can lead to indecision or
incorrect trades.
o
Reward: A more nuanced understanding of
market movements, leading to potentially
more accurate trading decisions.
•
Using Trailing Stop Orders
o
Risk: In volatile markets, stops might be hit
prematurely, leading to an exit before
maximum profits are realized.
o
Reward: Allows profits to run during
favorable trends while safeguarding against
significant losses.
•
Employing Additional Technical Indicators
o
Risk: Overcomplication of strategy and
potential for 'analysis paralysis', where too
many indicators lead to confusion.
o
Reward: Increased validation of trading
signals, leading to potentially more informed
and confident trading decisions.
Psychological Aspects of the Profit Box
Trading within the confines of the Profit Box also has
significant psychological implications. The pressure to
make quick decisions, especially in strategies like
scalping, can be mentally taxing. There's also the
emotional challenge of watching a profitable trade
Page: 36
Disclaimer: There is a chance of loss when trading Stocks, Futures and Options.
See full risk disclosure online at: PitNews.com/risk.htm Copyright © PitNews Press, Inc.
turn against you, a common occurrence when exits
are not timed well within the Profit Box framework.
Additionally, there's the psychology of 'fear of missing
out' (FOMO), which can lead traders to deviate from
their strategies, especially in non-trending markets or
when trailing stops are hit. Balancing the emotional
aspects of greed and fear is crucial in making
rational decisions that align with one’s trading plan.
Effective trading within the Profit Box thus requires
not only a solid understanding of the technical
aspects of each strategy but also a strong
psychological mindset. This involves discipline,
emotional control, and the ability to stick to a well-
thought-out trading plan despite the inevitable ups
and downs of market movements.
Thought-Provoking Question
As you reflect on the concept of the Profit Box and
its implications, consider this: How can you adjust
your current trading strategies to better recognize
and capitalize on the Profit Box in your trading
environment? Are there aspects of your approach
that might be limiting your profit potential or
exposing you to unnecessary risk?
Remember, the journey of a trader is one of constant
learning and adaptation. Embrace the challenge of
the Profit Box, use it to sharpen your trading skills,
and let it guide you in mastering the art of
balancing risk and reward. As you navigate the
market's tides, let your newfound understanding of
the Profit Box steer you towards more informed
trading decisions.
Lan Turner teaches finance at Utah Tech University
and has been a guest lecturer at the Chicago Board
of Trade and Chicago Mercantile Exchanges. As the
editor-in-chief of PitNews Magazine and contributing
author, he brings a wealth of knowledge to his
readers.
Page: 37

Gain Discipline and Courage Through
Knowledge & Strategy.
Master the Art of Technical Trading.
Immerse yourself in the world of trading - part-
time or full time - with my expert course on
Technical Analysis. Unlock the intricate world of
mathematical indicators, Fibonacci Projections,
and Elliot Wave theory.
Deep-Dive into Core Concepts: Understand
the fundamentals of technical analysis.
Hi, I’m Lan Turner, a seasoned veteran trader,
and I believe that "Trading is not about making
money, trading is about not losing money, and
until you master that concept, you’ll never find
success in these markets."
In this course, we'll equip you with advanced
strategies, guide you through what to do after a
buy or sell signal appears.
•
Beyond Basics: Explore advanced strategies
and learn to manage trades effectively.
•
Strategic Exits: Master the art of exiting
positions, whether your trade was right or
wrong.
Remember, "Trading is like playing chess. Most
people know how the pieces move, but few know
the strategies necessary to win the game."
Refine Your Skills: Develop and hone your skills
for trading success.
Click Here to LEARN MORE and unlock your
trading potential with this interactive training.
Disclaimer: There is a chance of loss when trading Stocks, Futures and Options.
See full risk disclosure online at: PitNews.com/risk.htm Copyright © PitNews Press, Inc.

One-On-One
Instruction
Video & Audio
Training


Page: 38

Disclaimer: There is a chance of loss when trading Stocks, Futures and Options.
See full risk disclosure online at: PitNews.com/risk.htm Copyright © PitNews Press, Inc.
The Hidden World of Prop Firms:
Separating Fact From Fiction
by Aiden Gray
It was a sweltering summer afternoon in Sedona
Arizona, where I sat comfortably in my air
conditioned loft surfing the web when I stumbled
upon it—the digital mirage that promised to quench
my thirst for financial freedom. "Get Funded! Trade
Our Money, $150,000 Account!" the banner ad
proclaimed, flashing across my screen like a neon
sign in a dark alley. My heart skipped a beat. I could
almost taste the success; it was intoxicating.
In the high-stakes world of trading, proprietary
trading firms, or "prop firms," offer a unique
opportunity for traders to amplify their gains.
However, not all prop firms are created equal. As
the trading landscape evolves, distinguishing
between legitimate and fraudulent prop firms has
never been more crucial. In this article, I want to
guide you through the maze of real and fake prop
firms, helping you make informed decisions that
could save you from financial pitfalls and lead you
toward genuine opportunities.
As I clicked through I found myself in the
labyrinthine corridors of their flashy website. "The
Combine," they called it—a vetting process that
promised to turn me into a trading prodigy. I felt a
surge of adrenaline. This was my golden ticket. But
as I read the fine print, a nagging doubt crept in.
Why did I have to pay to prove my worth? I brushed
it aside, attributing it to nerves. Little did I know, I
was stepping into a carnival game rigged against
me.

Page: 39
Disclaimer: There is a chance of loss when trading Stocks, Futures and Options.
See full risk disclosure online at: PitNews.com/risk.htm Copyright © PitNews Press, Inc.
Real Prop Firms: Characteristics
Real prop firms are institutional trading companies
that hire traders to trade the firm's capital. Unlike
brokerage accounts where you trade your own
money, prop firms provide you with a large pool of
capital to trade with, amplifying your potential
gains—and losses.
The Emotional Whirlpool
Days turned into weeks, and the combine became
my obsession. Each trade was a roll of the dice, and
each loss was a stab at my ego. The emotional toll
was unquantifiable. I felt like a moth drawn to a
flame, unable to break free. And then came the
vultures, offering me "exclusive" courses to improve
my skills. $1,000 here, another $1,000 there. “Learn
from us,” they said. “We’ll teach you how to pass the
combine!” they promised. Months later, what did I
have to show for it? A bruised ego and a lighter
wallet.
A Reputable Prop Firm’s Selection Process
Securing a position at a reputable prop trading firm
mirrors the rigor of a job application in a highly
competitive industry. The selection process is
multifaceted, involving an initial application, several
rounds of interviews, and rigorous trading
simulations under the watchful eye of your potential
financial partner. These steps are designed to

meticulously assess a candidate's trading acumen,
strategic thinking, and risk management skills.
Demonstrating a Proven Trading History
A prerequisite for consideration is a verifiable track
record of successful real-money trading. This history
serves as your professional portfolio, highlighting
your proficiency in trading and your ability to
manage risks effectively.
Entering a legitimate prop firm is challenging and
demands exceptional analytical and mathematical
prowess. In order to ensure a good cultural and team
fit, the journey typically starts with thorough
interviews.
Financial Commitments: Infusing Personal Capital
Once accepted, you're generally expected to infuse a
certain amount of your own capital, often upwards
of $100,000. This serves as both your commitment
and a risk buffer for the firm.
Profit-Sharing Models
In return for your investment and skills, the firm
allocates a large trading account to you, often
exceeding $1 million. As payment, you keep a
significant portion of the profits, usually around 50%
in the beginning, which can increase to as much as
70% with time, experience, and tenure.
Risks and Rewards
The catch? If you lose the amount you initially
brought to the firm, you're out. It's a high-risk, high-
reward environment that filters out those who can't
withstand the pressures of institutional trading.
The Harsh Realization
It took far longer than it should have for the harsh
truth to dawn on me: The combine was not designed
for me to win; it was designed for me to fail. In this
game, the odds were always in the house's favor,
and I, unwittingly, played the part of the naïve
carnival-goer, seduced by the false promise of easy
riches. This realization hit me hard, like a sudden,
Page: 40
Disclaimer: There is a chance of loss when trading Stocks, Futures and Options.
See full risk disclosure online at: PitNews.com/risk.htm Copyright © PitNews Press, Inc.
unexpected blow. Feelings of betrayal, exploitation,
and embarrassment washed over me. Deep down, I
always sensed this bitter truth, yet I chose to ignore
it, clinging to the hope that it was all real.
Fake Prop Firms: Characteristics:
Fake prop firms often masquerade as legitimate
trading companies but lack the stringent entry
requirements and risk management protocols that
real prop firms have. They often lure in traders with
promises of "free money" and easy entry. Offering
upwards of 90% payouts, where legitimate prop
firms are closer to 50%.
These firms advertise aggressively, inviting everyone
and anyone to try their hand at trading. Their
message is clear: "Come on in! We'll fund your
account. Free money for everyone!" But as the
saying goes, if it sounds too good to be true, it
probably is has never been more true than in the
financial industry.
The "Carnival Combine" as a Vetting Process
Many fake prop firms use what they call a "combine"
or some other term they’ve coined to indicate a
testing period, as a way of “vetting” potential
traders. However, this combine is more akin to a
rigged carnival game than a legitimate vetting
process. They charge you for the privilege of proving
yourself, while the game is designed for you to lose.
Hidden Costs: Software, Data, and Education
Subscriptions
Beyond the carnival fees, these firms often require
you to subscribe to their trading software, data
feeds, and even educational courses. I once met a
trader who spent $30,000 on such "education," only
to find himself back at square one, no funded
account.
The Difficulty of Maintaining a Funded Account
Even if you miraculously pass their combine,
maintaining the funded account is another uphill
battle. The rules are stringent, and failure to comply
results in losing your funded status.
The Carnival Combine: How Fake Prop Firms Rig
the Game
Just like a carnival game at your local fairgrounds,
they’ve been designed for you to lose. Fake prop
firms set up their combines with nearly impossible
criteria. The goal isn't to find successful traders; it's to
keep you paying for the opportunity to prove
yourself through education, and subscription services.
The Psychological Tactics Used to Lure Traders
These firms are masters of psychological
manipulation. They parade the rare success stories to
give you the illusion that you, too, could be one of
them. But remember, these are the exceptions, not
the rule.
Just like in your local community traveling carnival,
generally speaking, the few people you do see
walking around the fairgrounds, holding a giant
panda, are usually plants. They’re there to give you
the illusion that someone’s winning these games, so in
your mind, you think, why not me?
The Real Business Model of Fake Prop Firms
The primary revenue for these firms isn't from
successful trading; it's from the endless stream of
hopeful traders paying for combines, software, and
educational courses. In essence, they're not in the
trading business; they're in the business of selling
dreams, while offering large affiliate commissions to

Page: 41
Disclaimer: There is a chance of loss when trading Stocks, Futures and Options.
See full risk disclosure online at: PitNews.com/risk.htm Copyright © PitNews Press, Inc.
any would-be YouTube influencer to peddle their
story.
Digital Learning Resources
In today’s digital era, aspiring traders are uniquely
positioned to gain invaluable knowledge, not only
through the vast resources available online but also
via classes at local community colleges. Platforms
like YouTube offer a treasure trove of free trading
knowledge, ranging from the basics to advanced
strategies. These online resources, combined with
structured coursework, can provide a comprehensive
and multi-faceted education in trading. Alongside
this, finding a reputable brokerage firm with robust
trading platforms, and connecting with experienced
mentors and trading communities, becomes more
accessible. This blend of digital learning, formal
education, and professional guidance requires
minimal initial investment, making the path to
trading success more attainable and less daunting
than ever before.
The Road Not Taken
In hindsight, I wish I had taken the tried-and-true
path of opening a traditional trading account. No
gimmicks, no false promises—just me, my skills, and
the market. It's a sobering thought that had I
invested that $10,000 in a legitimate account, I
would have had the freedom to trade on my own
terms, without the circus overlords scrutinizing my
every trade.
Red Flags for Identifying Fake Prop Firms
Number 1: No Requirement for a Real-Money
Trading Track Record--the first glaring discrepancy
between real and fake prop firms is the absence of
stringent entry requirements. Legitimate proprietary
trading firms hold prospective traders to an elevated
standard, requiring a verifiable trading history that
involves real money. This due diligence serves as an
effective filter to identify individuals who have not
only the theoretical understanding but also practical
experience in navigating the complexities of financial
markets.
On the other hand, fake prop firms do not
emphasize or even require a trading track record
involving real money. The absence of this
requirement should be an immediate red flag
because it indicates that these firms are more
interested in garnering fees than in investing in
skilled traders.
Number 2: Upfront Fees for “Assessments”. Unlike
genuine prop firms where you'd never have to pay
to be interviewed, fake prop firms are notorious for
charging upfront fees for assessment programs. These
so-called assessments claim to evaluate your trading
skills but are generally structured in a way that
doesn't genuinely assess your potential as a trader.
Instead, they serve as another income source for the
masquerading firm. This upfront fee is antithetical to
the practices of legitimate firms where the vetting
process costs nothing for the prospective trader.
These assessments are usually designed with stringent
or unrealistic conditions that are difficult to meet,
ensuring that most applicants will fail. So, even as
participants expend time, effort, and money, the
firm continues to rake in profits, not from successful
trading, but from the ever-revolving door of hopeful
candidates.

Page: 42
Disclaimer: There is a chance of loss when trading Stocks, Futures and Options.
See full risk disclosure online at: PitNews.com/risk.htm Copyright © PitNews Press, Inc.
The Tried and True Method: Private Accounts. The
Benefits of Trading in a Private Account.
If you're looking to build a trading career, in my
opinion, the best path is the tried and true method
of trading your own private account. This allows you
to gain real-world experience without the smoke,
mirrors and ridiculous rules of fake prop firms.
Gain Experience and Grow Your Own Money
By trading in your own account, you can develop
your strategies, learn risk management, and grow
your capital at your own pace. There are plenty of
reputable trading firms and platforms that offer
robust tools and resources to help you succeed. This
also builds your “resume” for that day you truly do
want to join a legitimate prop firm.
A Lesson Hard Learned
If there's one thing I want you to take away from my
cautionary tale, it's this: Do your due diligence. Real
prop firms are legitimate businesses that require
proven skills and financial commitment. Don't be
swayed by the allure of quick riches and shortcuts. In
the world of trading, there are no free lunches, only
costly lessons. knowledge is power. Whether you're
considering joining a prop firm or trading on your
own, it's crucial to do your due diligence. Don't fall
for the allure of easy money and lofty promises.
Remember, in trading, as in life, there are no
shortcuts to success.
Aiden Gray is an avid full-time trader living in Sedona,
Arizona. He specializes in day trading futures and
stock options with Track ‘n Trade Live. Aiden is a
member of Lan Turner’s President’s Club and a
contributing writer to PitNews Magazine.


Page: 43
Disclaimer: There is a chance of loss when trading Stocks, Futures and Options.
See full risk disclosure online at: PitNews.com/risk.htm Copyright © PitNews Press, Inc.
Page: 44

Letter to the Editor


Disclaimer: There is a chance of loss when trading Stocks, Futures and Options.
See full risk disclosure online at: PitNews.com/risk.htm Copyright © PitNews Press, Inc.
Scans & Finds Historically Repeating Market
Cycles and Trends
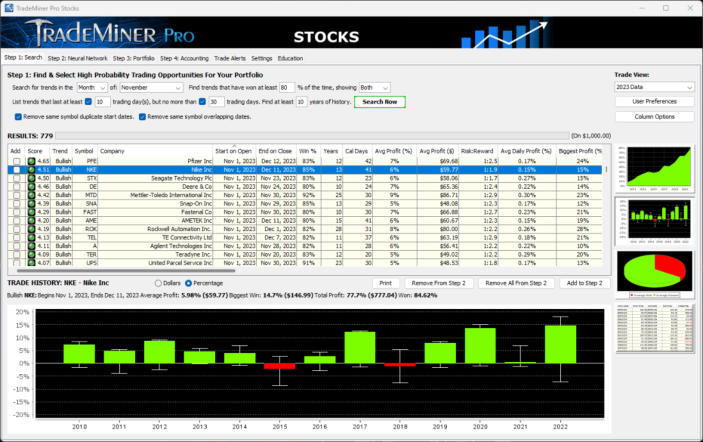
TradeMiner
Market Data Miner
Find the right stock-futures
to trade at the right time
www.TradeMiner.com

Page: 45

TradeMiner Stocks
Bullish Bect
on, Dickinson and Co (BDX)
Begins
Jan 4, 2024, Ends Feb 2, 2024
39 years, 87%, 10 tradi
ng da
ys, no more than 30 tradi
ng days.
Score
3.55
Probability
Not
Yet
Calcu
lat
ed
Wi
n
%
87.18%
Cal
Days
30
Avg
Profit
(%)
5.
49%
Avg
Profit
($)
$54.91
Sector
Health Care
Ind
ustry
Health Care Equipment
& Supplies


1990
198
5
1990
1995
200
0
2005
201
0
201
5
202
0
-200
-100
0
100
200
300
200
0
201
0
2
02
0
0
500
1,000
1,500
2,000
Begin
Date
Begin
P
rice
End
Date
E
nd
Price
Max Gain
Max Draw
Jan 6, 2022
243.09
Feb 2,
2022
247.91
$67
.03
-$10
.57

Jan 6, 2022
242.19
Feb 2,
2022
247.00
$67
.03
-$10
.57

Jan 7, 2021
241.56
Feb 2, 2021
245.15
$50
.74
-$15.5
6

Jan 7, 20
20
2
54.37
Feb 4,
2020
2
66.43
$54
.61
-$5
.34

Jan 7, 20
19
2
00.59
Feb 4,
2019
2
28
.66
$153.54
-$2.21

Jan 5, 20
18
2
03.11
Feb 2,
2018
2
16
.58
$11
7.01
-$9.4
9

Jan 6, 2017
1
48.74
Feb 2, 2017
1
60.16
$97
.71
-$2.12

Jan 7, 2016
1
27.93
Feb 2,
2016
1
28.39
$25.33
-$47
.2
6

Jan 7, 2015
1
22.63
Feb 3, 2015
122.90
$41
.30
-$34
.77

Jan 7, 2014
94
.23
Feb 4, 2014
90.58
$22.0
3
-$45.97

Jan 7, 2013
67
.09
Feb 4,
2013
7
1.27
$71
.48
-$3.62

Jan 6, 2012
59
.49
Feb 2,
2012
64.83
$10
1.58
-$6.18

Jan 6, 2011
66
.63
Feb 2, 2011
66.93
$19
.8
0
-$21
.48

Jan 7, 2010
60
.67
Feb 2, 2010
6
0.33
$15.24
-$34
.8
6

Jan 7, 2009
51
.94
Feb 3, 2009
5
6.68
$140.34
-$10
.5
0

Jan 7, 2008
66
.66
Feb 4, 2008
6
6.72
$47
.7
8
-$80
.1
2

Jan 8, 2007
52
.38
Feb 2, 2007
57.59
$104.90
-$4.56

Disclaimer: There is a chance of loss when trading Stocks, Futures and Options.
See full risk disclosure online at: PitNews.com/risk.htm Copyright © PitNews Press, Inc.
Page: 46
Bullish Netflix Inc (NFLX)
Begins
Jan 25, 2024, Ends Feb 19, 2024
16 years, 87%, 10 tradi
ng da
ys, no more than 30 tradi
ng days.
Score
4.21
Pr
obabi
lity

Wi
n %
8
7.5
%
Cal Days
Avg Profit (%)
13.72%
Avg Pro
fit ($)

Sector
Cons
umer Goods
Industry


201
0
200
8
201
0
201
2
201
4
201
6
201
8
202
0
202
2
-200
-100
0
100
200
300
4
00
201
5
202
0
0
500
1,000
1,500
2,000
Begin
Date
Begin
P
rice
End
Date
E
nd
Price
Max Gain
Max Draw
Jan 25, 2
022
379.14
Feb 15
, 202
2
407.46
$20
9.26
-$59
.40

Jan 25, 2
022
379.14
Feb 15
, 202
2
407.46
$20
9.26
-$59
.40

Jan 25, 2021
567.00
Feb 16
, 202
1
5
57.28
$4.85
-$90
.4
2

Jan 27, 2020
345.95
Feb 18, 202
0
387.78
$12
6.00
-$21
.3
9

Jan 25, 2
019
32
8.72
Feb 15
, 201
9
356.87
$10
8.54
-$1.73

Jan 25, 2018
263.00
Feb 15, 2018
2
80.27
$90
.53
-$10
2.24

Jan 25, 2017
140.80
Feb 15, 201
7
1
42.27
$36
.58
-$16
.2
6

Jan 25, 2016
99
.7
8
Feb 17
, 201
6
94.76
$29
.06
-$19
8.74

Jan 26, 2015
62
.57
Feb 17
, 201
5
6
7.14
$76
.7
1
-$9.84

Jan 27, 2014
55.3
4
Feb 18
, 201
4
6
2.41
$13
9.01
-$43
.44

Jan 25, 2
013
20
.81
Feb 15
, 201
3
2
7.07
$304.32
-$0.41

Jan 25, 2012
13
.24
Feb 16
, 201
2
1
7.42
$43
9.37
-$11
.3
3

Jan 25, 2011
26.14
Feb 15
, 201
1
3
4.40
$35
2.81
-$7.8
1

Jan 25, 2010
7
.29
Feb 16, 201
0
9.2
7
$27
3.46
-$49
.5
6

Jan 26, 2009
4
.34
Feb 17, 200
9
5.3
2
$277.30
-$42
.4
3

Jan 25, 2008
3
.18
Feb 19
, 200
8
3.8
3
$238.78
-$52
.06

Disclaimer: There is a chance of loss when trading Stocks, Futures and Options.
See full risk disclosure online at: PitNews.com/risk.htm Copyright © PitNews Press, Inc.
Page: 47
12 Days
TradeMiner Stocks
Bullish He
rs
hey Co (The)
(HSY)
Begins Jan 30, 2024, Ends Feb 26, 2024
37 years, 89%, 10 tradi
ng da
ys, no more than 30 tradi
ng days.
Score
3.67
Probability
No
t
Yet
Calcu
lated
Wi
n
%
89.19%
Cal
Days
28
Avg
Profit
(%)
4.2%
Avg
Profit
($)
$4
2.00
Sector
Consumer Goods
Industry
Food Products


1990
1
987
1
992
1997
200
2
2
00
7
201
2
201
7
2
02
2
-100
-50
0
50
100
150
200
1995
2
00
0
2005
201
0
201
5
202
0
0
250
500
750
1,000
1,250
1,500
Begin
Date
Begin
P
rice
End
Date
E
nd
Price
Max Gain
Max Draw
Jan 28, 2022
190.96
Feb 23, 2022
2
00.78
$73
.89
-$13
.0
2

Jan 28, 2022
190.08
Feb 23, 2022
1
99.85
$73
.89
-$13
.0
2

Jan 28, 2021
140.95
Feb 23, 2021
1
43.22
$56
.50
-$12
.2
3

Jan 30, 2020
142.63
Feb 25, 202
0
1
48.94
$68
.96
-$1.52

Jan 30, 2019
96.95
Feb 25
, 201
9
1
01.54
$66
.94
-$41
.92

Jan 30, 2018
97.92
Feb 23, 2018
87.48
$15.38
-$122.6
3

Jan 30, 2017
92.63
Feb 23, 2017
95.68
$39.1
9
-$39
.51

Jan 28, 2016
73.23
Feb 24
, 201
6
77.96
$78
.7
4
-$38
.5
0

Jan 29, 2015
85.01
Feb 24, 201
5
88.64
$55.44
-$31
.3
0

Jan 30, 2014
79
.81
Feb 25
, 201
4
87.60
$11
7.41
-$9.62

Jan 30, 2013
62.2
5
Feb 25
, 201
3
64.86
$57
.7
0
-$1.67

Jan 30, 2012
47.8
3
Feb 24
, 201
2
48.11
$17
.3
4
-$29
.77

Jan 28, 2011
36.57
Feb 23, 2011
38.77
$81.31
-$29
.2
0

Jan 28, 2010
27.64
Feb 23, 201
0
2
9.34
$75.36
-$32
.9
8

Jan 29, 2009
26.73
Feb 24
, 200
9
24.70
$26
.3
1
-$90
.4
3

Jan 30, 2008
25.40
Feb 26, 2008
2
6.30
$48
.05
-$65.87

Jan 30, 2007
34
.48
Feb 23, 200
7
36.15
$69
.63
-$6.68

Disclaimer: There is a chance of loss when trading Stocks, Futures and Options.
See full risk disclosure online at: PitNews.com/risk.htm Copyright © PitNews Press, Inc.
Page: 48
TradeMiner Stocks
by PitNews Magazine
Are you passionate about the financial markets and
sharing trading insights? Then why not join the
PitNews Magazine Affiliate Program and turn your
passion into profits?
•
Earn 100% commissions on each first year's
subscription fees, and 50% every year thereafter.
•
Capitalize on our popular online trading courses
with up to a 100% commissions.
As an affiliate of PitNews Magazine, you're aligning
with a publication celebrated for its high-quality,
and insightful content at a fantastic prices. feel
confident representing a brand that stands for
excellence in the financial sector, a product and
service you'll be proud to endorse.
Turn Your Passion Into Profits with
PitNews Magazine!

Registering is a simple process, where you’ll gain
access to your very own online portal for support,
tracking and promoting the magazine.
PitNews Magazine is your path to residual earnings:
Attract just three subscribers per week and see your
income compound to over six thousand dollars in the
first year alone!
Join our affiliate program today and embark on a
journey of growth and profit with PitNews
Magazine. To learn more and to apply, visit us on
the web at www.PitNews.com/Affiliates
Join our affiliate program and start transforming
your passion into earnings. Don’t let this opportunity
pass you by; there’s no cost or obligation to you.
Page: 49

PitNews Magazine
In-Depth Insights, Analysis, and Education on Trading and Financial
Markets; Stocks, Futures & Options
Published by: PitNews Press, Inc.
About PitNews Magazine
PitNews Magazine is a renowned publication in the trading and financial industry, known for its
insightful analysis and comprehensive education on various market aspects, and has been in
publication since 1998. Our aim is to equip traders and investors with the tools, knowledge, and
strategies they need to excel in the competitive world of Stocks, Futures, and Options.
Featuring contributions from seasoned professionals and experts, our magazine includes
articles from our acclaimed Editor-in-Chief, Lan H. Turner, and distinguished traders and
contributing columnists such as Dr. Scott Brown, Aiden Drake, L. Ben Turner, David Duty, Claire
Kristensen, among others. Note that some author names have been altered for privacy. All
articles, examples, and stories in PitNews Magazine should be considered, from a legal
standpoint, as works of fiction used to illustrate strategies or further narratives, unless
specifically stated otherwise. Our magazine provides readers with a cutting-edge perspective on
trading strategies, software platforms, research tools, and much more.
We utilize artificial intelligence tools to assist in researching topics, editing articles, creating
graphics and images, and suggesting grammar and spelling corrections. In fact, this copyright
notice was crafted and refined using artificial intelligence to improve readability.
If you're interested in joining our team, contributing an article, or becoming an affiliate reseller
of our magazine and other services, please visit our website for registration details. For more
information about PitNews Magazine, visit www.PitNews.com.
Copyright © PitNews Press, Inc., All rights reserved.
No part of this publication may be reproduced, distributed, or transmitted in any form or by any
means, including photocopying, recording, or other electronic or mechanical methods, without
the prior written permission of the publisher, except in the case of brief quotations embodied in
critical reviews and certain other noncommercial uses permitted by copyright law. All images
have been licensed or created specifically for PitNews Magazine.

Page: 50

Magazine

PitNews
Your Trusted Source for Trading Intelligence: www.PitNews.com
Unlock Your Trading Potential
with PitNews Magazine
Subscribe Today!
Published Since 1998
ONLY $39.95 a Year!
Please Visit & Support Our Sponsors:
Gecko Software, Inc.
TrackNTrade.com
TradeMiner.com
ChartMiner.com
TradeMentors
TradeMentors.com
PitNews Magazine
PitNews.com


1 / 1
100%